Retail · Data Engineering
Retail Sales Data Mart & BI Dashboard
End-to-end retail analytics, automated ETL pipeline, star-schema warehouse, business-ready data marts, and Power BI dashboards covering sales overview, delivery, returns, and customer profitability.
ETL
Automated pipelines
Star Schema
Warehouse modeling
01
The Challenge
A multi-region retailer ran reporting out of fragmented CSV exports, brittle spreadsheets and overnight database queries, by the time the team saw delivery, returns or profitability numbers, the trend had already changed and decisions lagged the business.
02
Our Approach
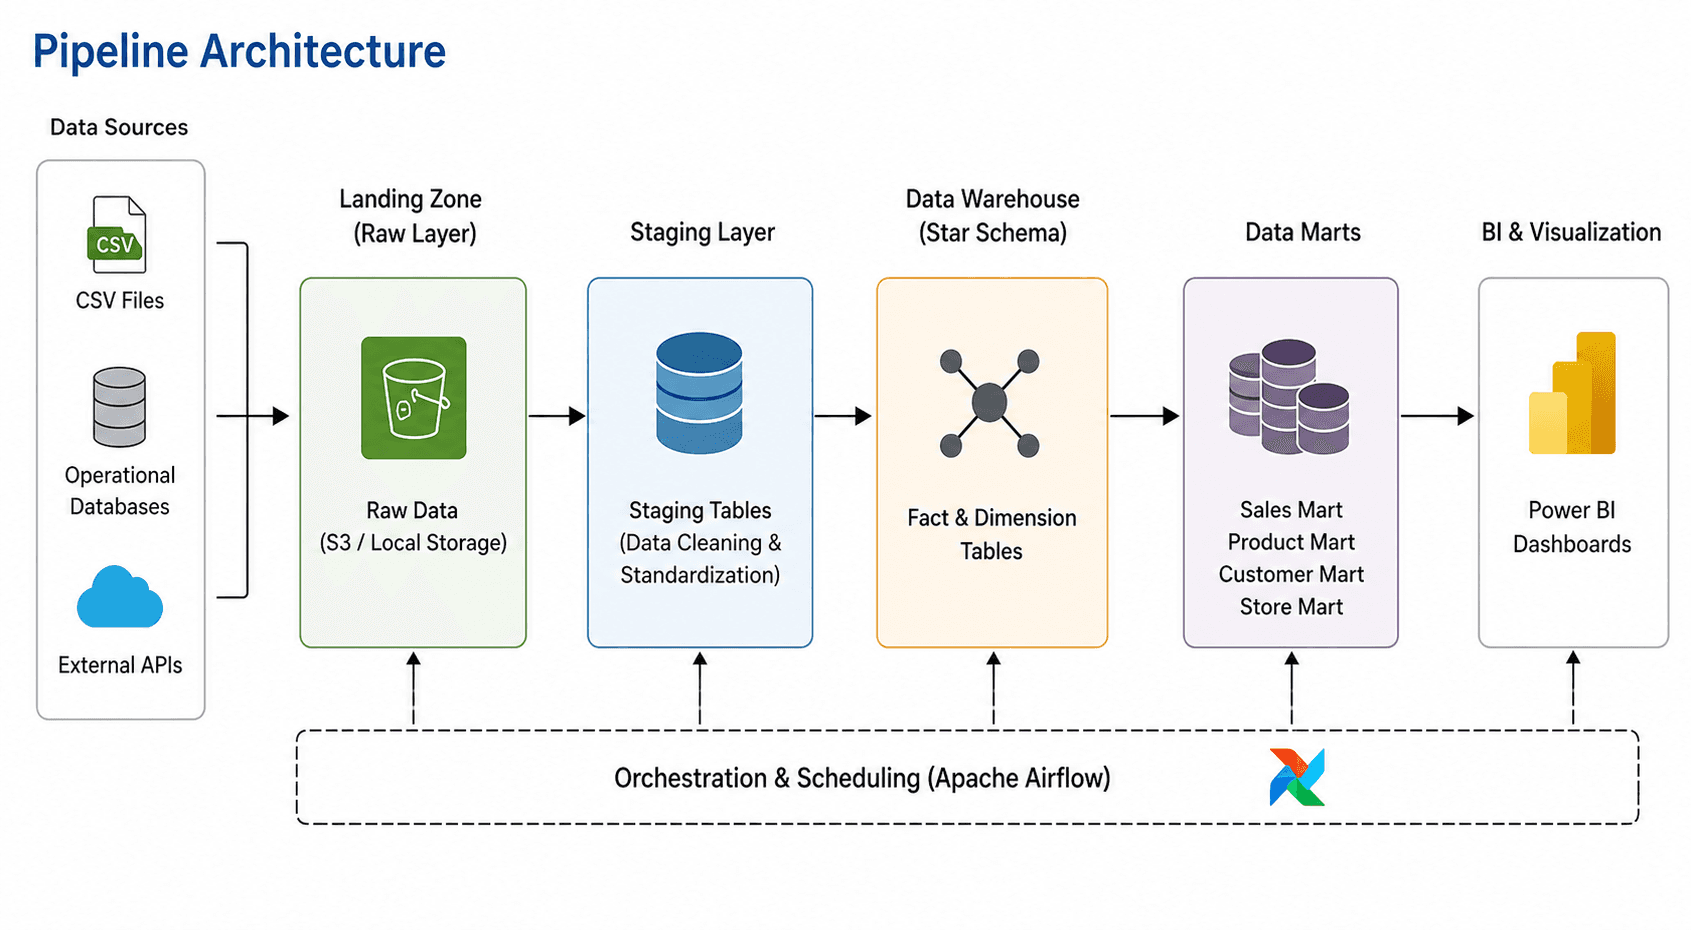
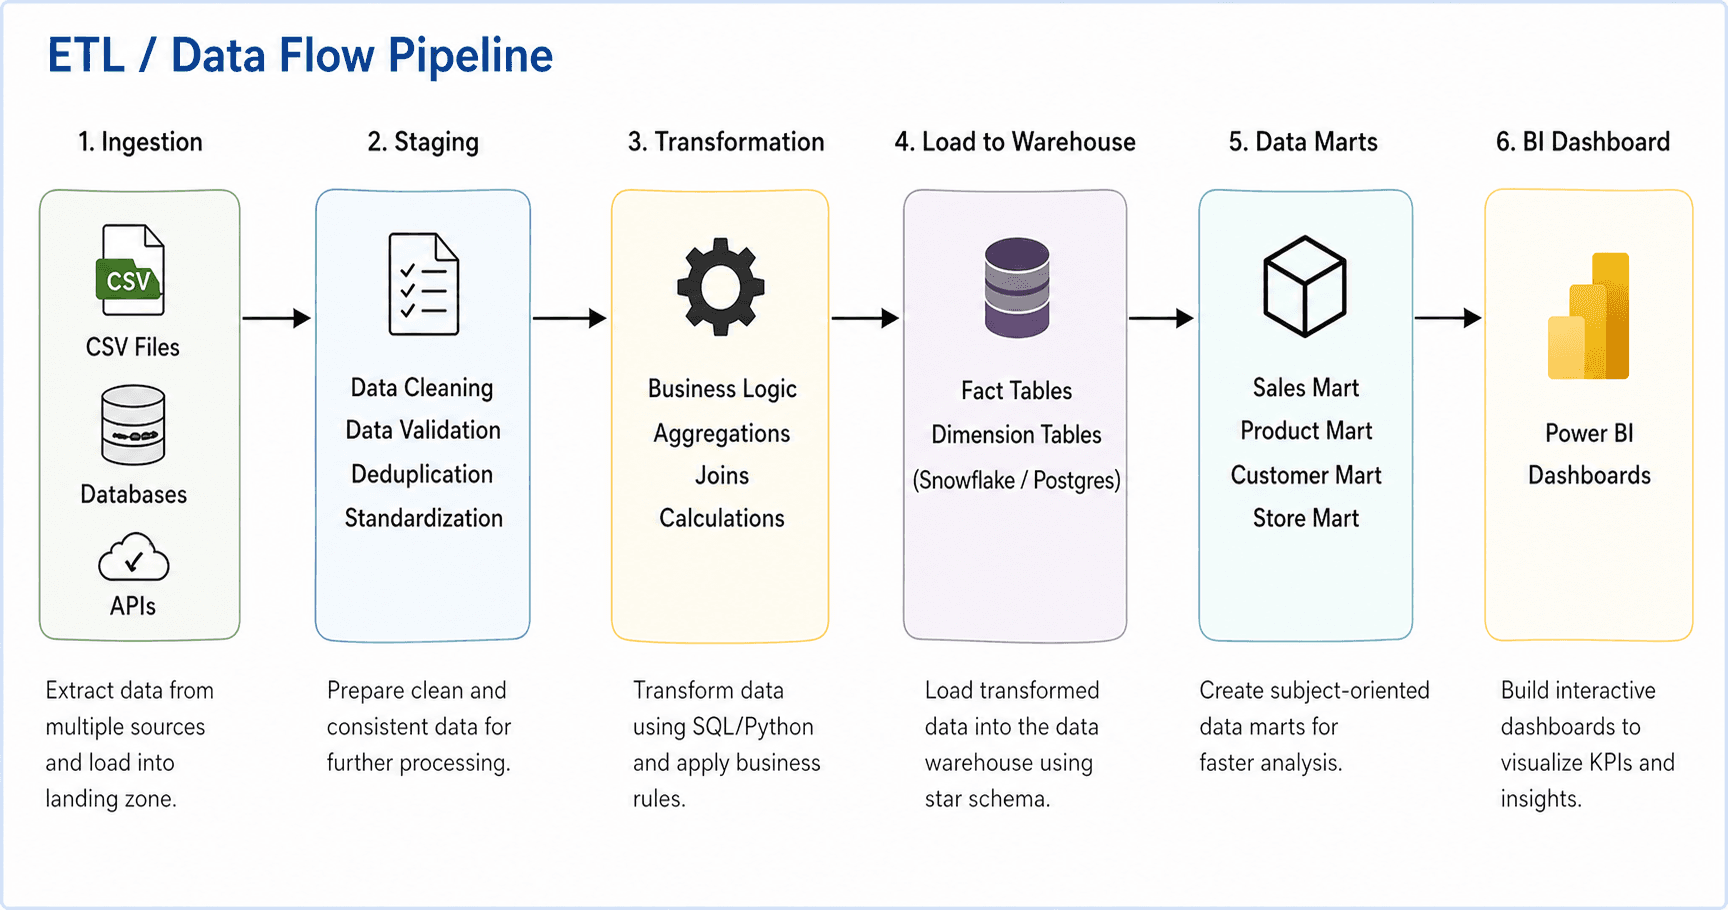
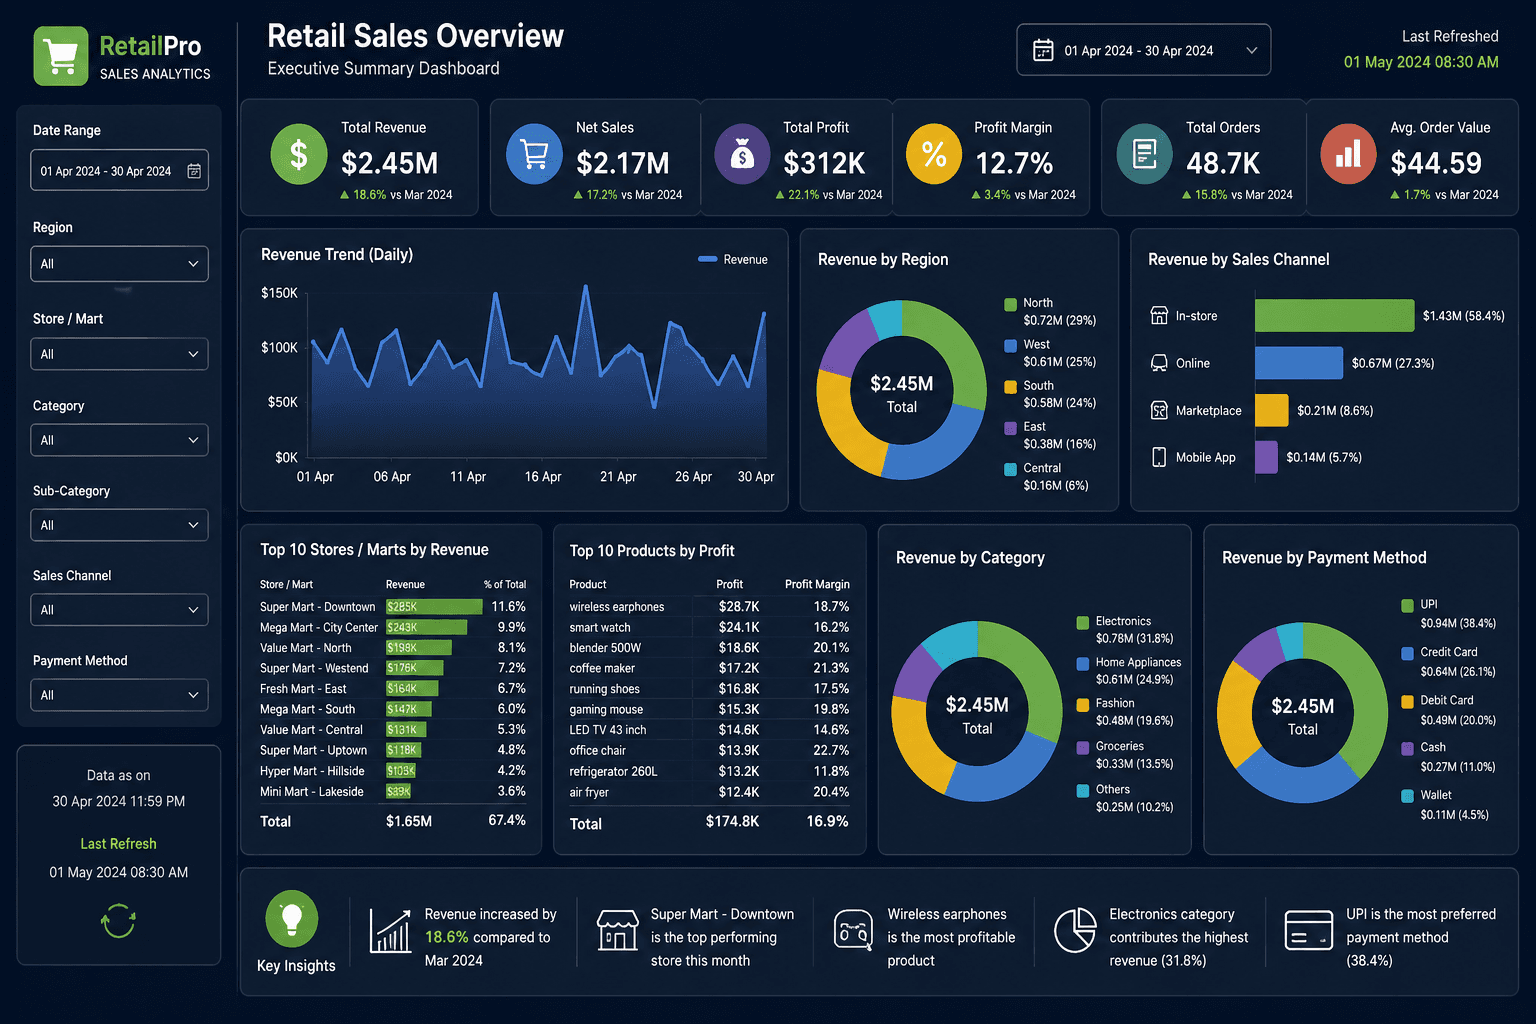
We built an automated ETL pipeline on Apache Airflow that lands operational data into PostgreSQL, modeled a star-schema warehouse with conformed dimensions for product, store, customer and date, then layered business-ready data marts feeding four Power BI dashboards: sales overview, delivery, returns, and customer profitability.
Stakeholders self-serve the dashboards every morning instead of waiting on analyst reports. Profitability and returns trends surface in near-real-time, planning cycles shrink from weeks to days, and the data foundation now supports new use cases without rework.

Want similar outcomes for your business?
Book a free 30-minute discovery call and we'll map out a tailored 30-day MVP roadmap for your idea, no fluff, no obligations.